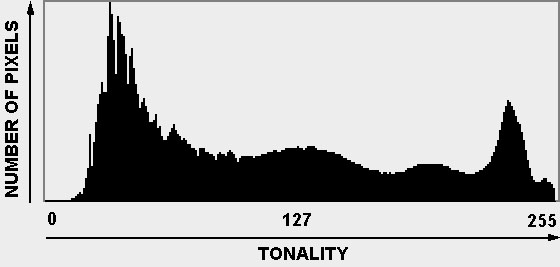
The ability to interpret correctly an RGB histogram is a key skill in digital photography. Each pixel within a digital image is represented by three 8-bit binary numbers, each of which gives a range of 256 tonal values (0 - 255). The three numbers represent the three separate tonal values for the red, green and blue (RGB) components of an image pixel, and together make up a 24-bit binary value. In each of the three 8-bit numbers, the value 0 represents black and the value 255 represents white. Half way along the scale, the value 127 represents the equivalent density of mid grey on the red, green or blue scale.
 Every colour in an RGB image is a mixture of the three elements, for example R255 plus G255 plus B0. This combination produces yellow
  . Add R255 plus G255 plus B127 and the result changes to a paler yellow. This is because blue is the complement of yellow, so adding blue decreases the saturation of the yellow
  . Add even more blue with B225 and the result is a very pale yellow
  . If all three components are set to the same value, as in R127 plus G127 plus B127, the result will be a tone on the greyscale - in this case the mid-tone on the greyscale which ranges from black to white.
The horizontal axis of the histogram is a scale from 0 to 255 representing the values assigned to pixels as described above. The vertical axis is a scale for the number of pixels in an image with each of the values on the horizontal scale. For example, in the histogram above, there might be 5,000 instances of pixels with the value 127. Further to the right there is a peak of about double this value which represents perhaps 10,000 instances of a pixel value of approximately 225.
The overall distribution of the histogram - the shape of the solid black area - tells an experienced eye the nature of the image it represents. A histogram having most of the samples (the black area) between the centre and the right-hand end represents an image consisting of mainly light tones - a high key image. A histogram having most of the samples situated towards the lower end represents a low-key image. Most images contain instances of pixels of every value from close to 0 to close to 255, although the actual shape of the histogram will depend upon the occurrence and relative sizes of light and dark areas in the image.
In the histogram above, the tonal distribution reveals a problem with the image. The pixel values lying between 0 and approximately 25 are not used, and those having a value of 255 are plentiful. This indicates that the histogram is too far to the right and hence somewhat overexposed. Numerous pixels have the value 255 (pure white) and some loss of detail has occurred at this end of the tonal scale. At the bottom end of the scale, between 0 and about 25, numerous tonal values are unused and hence wasted. If the exposure was reduced by perhaps half a stop the whole histogram would move to the left, occupy the unused lower values, and make better use of the range of tones at the bright (255) end of the scale.


